How Horse Racing Odds Work: Fractional and Decimal Explained
Best Horse Racing Betting Sites – Bet on Horse Racing in 2026
Loading...
Every number on a betting board tells a story. It speaks of probability, potential profit, and the bookmaker’s opinion of a horse’s chances. Understanding how horse racing odds work is the first genuine step toward informed betting—without this knowledge, you’re essentially guessing at what your returns might look like.
British racing traditionally displays odds in fractional format—the 5/1 and 7/2 figures that have decorated racecards for centuries. Betting exchanges and European bookmakers prefer decimal odds, a cleaner system that shows your total return in a single number. Neither format is inherently better; they simply present the same information differently. Learning to read both gives you flexibility when comparing prices across bookmakers, and that flexibility often translates directly into better value.
This guide breaks down both formats, shows you how to convert between them, and explains the implied probability hidden within every price. Read the odds, know your returns.
Fractional Odds Explained
Fractional odds represent the profit you stand to make relative to your stake. When you see 5/1 (spoken as “five to one”), the first number shows potential profit while the second shows the stake required. Back a horse at 5/1 with £10, and you receive £50 profit plus your £10 stake returned—£60 total. The arithmetic is straightforward: multiply your stake by the top number, then divide by the bottom number.
Prices like 7/2 work identically. That £10 bet returns £35 profit plus the original £10, giving you £45 in hand. For every £2 you risk, you stand to gain £7. Some punters find these non-integer fractions confusing at first, but they simply reflect more precise probability assessments than round numbers would allow.
Odds-on prices flip the relationship. At 1/2 (or “one to two”), you must stake £2 to win £1. A £10 bet at 1/2 returns just £5 profit, plus your stake—£15 total. The horse is considered more likely to win than lose, and the odds reflect that. Similarly, 4/6 means you stake £6 to profit £4, while even money (1/1 or “evens”) returns exactly your stake as profit.
The fractional system carries centuries of racing history. It emerged from the oral traditions of racecourse bookmakers who needed quick mental calculations and clear communication across crowded betting rings. When a layer shouts “four to one bar one,” everyone within earshot understands exactly what that means. This clarity under pressure explains why fractions remain dominant on UK racecourses today, even as digital platforms embrace decimals.
Consider a practical example. You fancy three horses across an afternoon card: one at 3/1, another at 9/2, and a third at 11/4. A £5 win bet on each commits £15 total. If the 3/1 selection wins, you collect £20 (£15 profit plus £5 stake). The 9/2 shot would return £27.50 (£22.50 plus stake), and the 11/4 brings back £18.75 (£13.75 plus stake). Quick mental maths keeps you informed about your exposure and potential outcomes—essential skills at any racecourse.
Decimal Odds Explained
Decimal odds show your total return per unit staked in a single figure. A price of 6.00 means a £1 bet returns exactly £6—your £5 profit plus the original £1 stake. No separate calculation required. This simplicity explains why betting exchanges like Betfair adopted decimals from the outset and why they’ve spread across European bookmakers.
The format proves particularly useful when comparing multiple bookmakers. Glancing at 4.50, 4.60, and 4.40 instantly reveals which operator offers the best price. With fractional equivalents (7/2, 18/5, and something less elegant), that comparison demands either conversion or genuine familiarity with the numbers.
Decimal odds below 2.00 indicate an odds-on selection. At 1.50, your £10 returns £15 total—£5 profit. At 1.25, that same tenner brings back just £12.50. The closer to 1.00, the shorter the price and the higher the implied probability of success.
Analysis from Geegeez comparing Betfair Starting Price with Industry SP found that BSP returns a higher price than Industry SP in 97.5% of cases across 2023-2026 UK racing data. That’s a remarkable statistic, and it partly reflects the efficiency of exchange markets where decimals enable faster, more precise trading. When punters can see 3.85 versus 3.80 at a glance, arbitrage opportunities close quickly, and prices find their true level.
Here’s how decimal odds translate in practice. You spot a horse at 5.50 and stake £20. Total return if it wins: £110. Profit: £90. Another runner catches your eye at 2.75—stake £20, return £55, profit £35. The mental arithmetic is minimal because the decimal figure already includes your stake. Multiply and collect.
Converting Between Formats
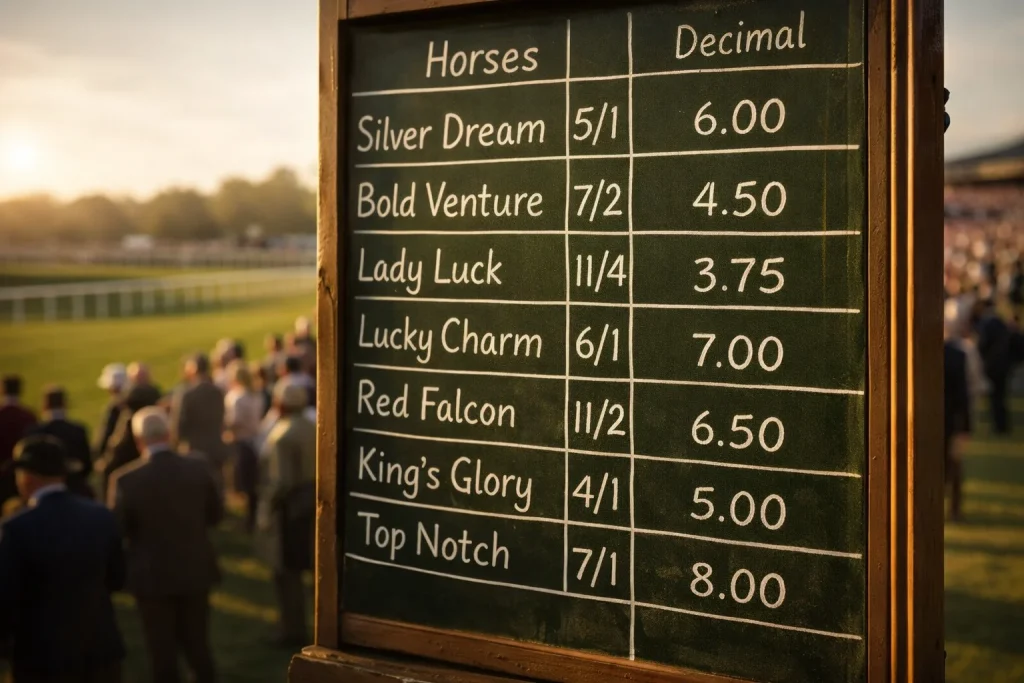
Converting fractional odds to decimal takes one simple formula: divide the first number by the second, then add 1. Take 5/1: divide 5 by 1 (equals 5), add 1, and you get 6.00. For 7/2: divide 7 by 2 (equals 3.5), add 1, giving 4.50. The added 1 accounts for your returned stake, which decimal odds always include.
Working backwards from decimal to fractional requires subtraction first. Start with 4.00, subtract 1 to get 3, and express that as 3/1. From 2.50: subtract 1 to get 1.5, which becomes 3/2 (or 6/4 in traditional bookmaker parlance). Decimals with longer fractional equivalents—like 4.33 converting to roughly 10/3—explain why bookmakers sometimes offer prices that look unusual in one format but natural in the other.
Certain conversions appear so frequently that memorising them saves time. The essential reference table: 1/1 (evens) equals 2.00; 2/1 converts to 3.00; 5/2 becomes 3.50; 3/1 equals 4.00; 4/1 translates to 5.00; 5/1 is 6.00; 6/1 converts to 7.00; 10/1 becomes 11.00. For odds-on prices: 1/2 equals 1.50; 4/5 is 1.80; 8/11 becomes approximately 1.73; 4/6 (or 2/3) equals about 1.67.
Most betting sites now offer format toggles, switching between fractional, decimal, and sometimes American odds with a single click. Use this to your advantage. If you spot a price that looks slightly off in one format, check it in the other—sometimes the conversion reveals hidden value or confirms that the apparent edge is genuine.
Implied Probability
Every set of odds carries an implied probability—the bookmaker’s assessment of how likely that outcome is to occur. Understanding this helps you identify when your own assessment differs from the market’s, and that difference is where betting value lives.
The conversion from decimal odds to implied probability is straightforward: divide 1 by the decimal odds, then multiply by 100 to get a percentage. At odds of 4.00, the implied probability is 1 ÷ 4.00 = 0.25, or 25%. At 2.00 (evens), the calculation gives 50%. At 1.50 (1/2 in fractional), you get approximately 66.7%.
For fractional odds, the formula adjusts slightly. Divide the second number by the sum of both numbers, then multiply by 100. At 3/1: 1 ÷ (3+1) = 0.25, or 25%. At 7/4: 4 ÷ (7+4) = 4/11, roughly 36.4%. This tells you the bookmaker believes there’s about a 36% chance of that horse winning.
Here’s where it gets interesting. Add up all the implied probabilities in a horse race, and the total will exceed 100%—typically landing between 105% and 120% depending on the market. That excess represents the bookmaker’s overround, their built-in margin. A book showing 115% total implied probability means the bookmaker expects to retain roughly 15% of the money wagered, regardless of which horse wins. Sharper bettors seek markets with lower overrounds, where the probabilities sum closer to 100%.
Research from racing statistics indicates that favourites win approximately 30-35% of all races. If the market prices a favourite at implied probability of 40% (odds of 2.50 or 6/4), you might question whether that price reflects genuine likelihood or just heavy public backing. Conversely, if your analysis suggests a 40% chance and the market offers 35% implied probability (odds around 2.85), you’ve potentially found value.
The gap between implied probability and your estimated true probability defines expected value. Bet consistently where you believe the true chance exceeds what the odds suggest, and mathematics tilts in your favour over the long run. Read the numbers correctly, and they start telling you more than just potential returns—they reveal opportunity.
Odds formats are simply different languages describing the same underlying reality. Whether you prefer the traditional rhythm of fractions or the clean precision of decimals, both communicate probability and potential profit. The real skill lies in interpreting what those numbers mean about a horse’s genuine chances—and spotting when the market has mispriced the risk.
Once you’re comfortable converting between formats and calculating implied probabilities, you can compare prices across bookmakers without mental friction. That comparison becomes second nature, and finding the best available price on every selection becomes automatic rather than effortful. Start simple, build fluency, and let the mathematics work for you.